The US Dollar started a downside move from well above 114.00 and declined below 107.00 against the Japanese Yen.
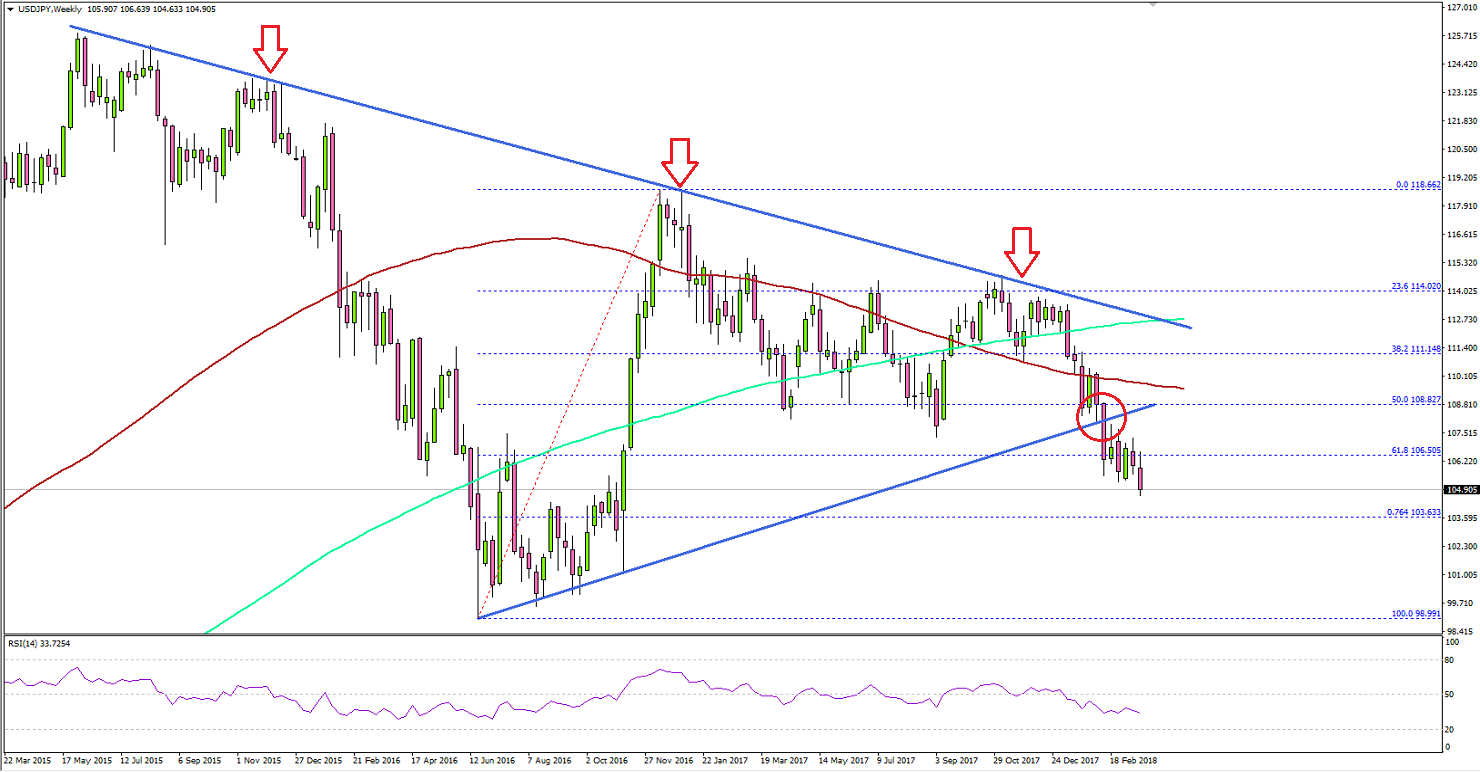
There was a break below a crucial bullish trend line with support at 108.50 on the weekly chart of USD/JPY.
The US Initial Jobless Claims for the week ending March 17, 2018 rose from 226K to 229K.
Today, the US Durable Goods Orders report for Feb 2018 will be released and the market is looking for an increase of 1.5% in orders.
USDJPY Technical Analysis
The past few weeks were mostly bearish for the US Dollar against the Japanese Yen. The USD/JPY pair started a major downtrend from the 118.50 swing high and is currently in a bearish zone below 108.00.Looking at the weekly chart, there are many bearish signs from the 118.66 high. The pair broke the 50% Fib retracement level of the last wave from the 98.99 low to 118.66 high.There was also a break and close below the 100-week simple moving average (red) and 200-week simple moving average (green). More importantly, there was a break below a crucial bullish trend line with support at 108.50 on the weekly chart.The pair is now trading well below the 108.00 level and it remains at a risk of more losses. The next major support is around the 76.4% Fib retracement level of the last wave from the 98.99 low to 118.66 high at 103.63.On the upside, the broken supports at 108.00 and 108.50 will most likely act as resistances if the pair corrects higher from the current or lower levels.Recently in the US Initial Jobless Claims for the week ending March 17, 2018 was released by the US Department of Labor. The market was looking for a minor decline from the last reading of 226K to 225K.The real outcome was discouraging since there was a rise in claims from 226K to 229K. The report added that:
In the week ending March 17, the advance figure for seasonally adjusted initial claims was 229,000, an increase of 3,000 from the previous week's unrevised level of 226,000. The 4-week moving average was 223,750, an increase of 2,250 from the previous week's unrevised average of 221,500.
Overall, the USD/JPY pair remains at a risk of more losses as long as it is below 108.5 and 110.00 on the weekly chart.
Economic Releases to Watch Today
US Durable Goods Orders for Feb 2018 – Forecast +1.5% versus -3.7% previous.
US New Home Sales for Feb 2018 (MoM) – Forecast +4.4% versus -7.8% previous.
Canadian Consumer Price Index Feb 2018 (YoY) – Forecast +2.0%, versus +1.7% previous.
Canadian Retail Sales Jan 2018 (MoM) – Forecast +1.1%, versus -0.8% previous.

 There was also a break and close below the 100-week simple moving average (red) and 200-week simple moving average (green). More importantly, there was a break below a crucial bullish trend line with support at 108.50 on the weekly chart.The pair is now trading well below the 108.00 level and it remains at a risk of more losses. The next major support is around the 76.4% Fib retracement level of the last wave from the 98.99 low to 118.66 high at 103.63.On the upside, the broken supports at 108.00 and 108.50 will most likely act as resistances if the pair corrects higher from the current or lower levels.Recently in the US Initial Jobless Claims for the week ending March 17, 2018 was released by the US Department of Labor. The market was looking for a minor decline from the last reading of 226K to 225K.The real outcome was discouraging since there was a rise in claims from 226K to 229K. The report added that:
