
Aayush Jindal
Key Highlights
- Crude oil price declined below the key $56.00support area against the US dollar.
- A crucial bearish trend is forming withresistance near $57.50 on the 4-hours chart of XTI/USD.
- The IBD/TIPP Economic Optimism declined from56.6 to 55.1 in August 2019.
- The EIA crude oil stocks (weekly measure) couldchange -3.313M (previous - -8.496M).
Crude Oil Price Technical Analysis
There was a strong decline in crude oil price from the $58.73 swing high against the US Dollar. The price broke the key $58.00 and $56.00 support levels to enter a bearish zone.
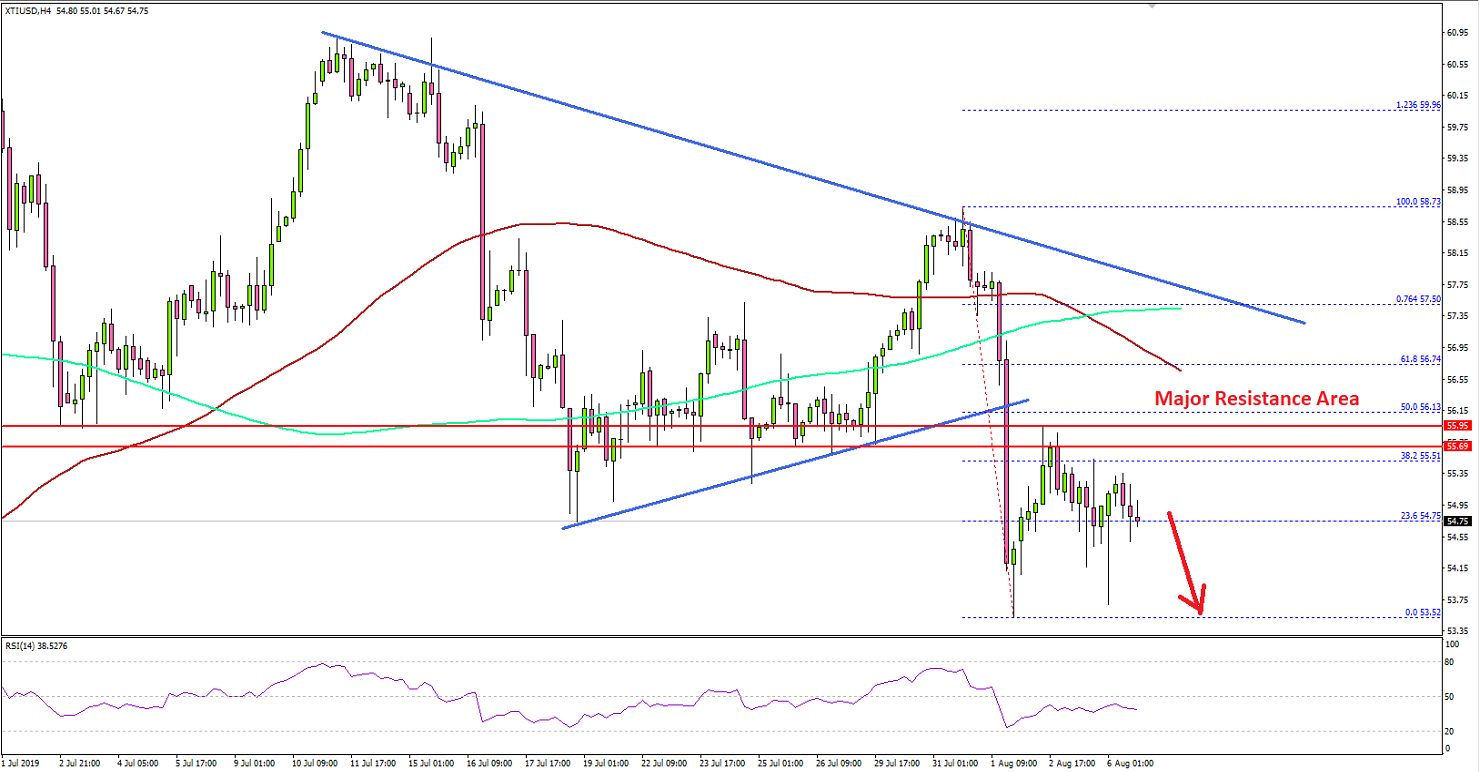
Looking at the 4-hours chart of XTI/USD, the price even declined sharply below the $55.0 and $54.00 levels. A swing low was formed near $53.52 and the price settled well below the 100 (red) simple moving average (4-hours).
Recently, there was an upside correction above the $54.50level plus the 23.6% Fib retracement level of the drop from $58.73 to $53.52. However,the upward move was capped by the previous support (now resistance) near$60.00.
Additionally, the price stayed below the 50% Fib retracementlevel of the drop from $58.73 to $53.52. More importantly, there is a crucialbearish trend forming with resistance near $57.50 on the same chart along withthe 100 SMA.
Therefore, the price is likely to face a strong resistanceon the upside near the $56.00 and $57.00 levels. A successful close above the$57.00 level and the 100 SMA is needed for a strong recovery in the comingdays.
Conversely, if the price fails to surpass $56.00 and $57.00,there could be a fresh decline. An immediate support is near the $54.00 level,below which the price could even slide below $53.50. The next important supportis near the $52.40 level.
Looking at major pairs, EUR/USD seems to struggling to hold recent gains, and GBP/USD is still trading in a downtrend below 1.2250.
Economic Releases to Watch Today
- Germany’s Industrial Production for March 2019(MoM) - Forecast -0.5%, versus +2.2% previous.
- EIA Crude Oil Stocks Change – Forecast -3.313M,versus -8.496M previous.
- Canada’s Ivey PMI August 2019 - Forecast 61.3,versus 60.0 previous.
