The Euro made a short-term top near 1.1960 and started a downside move versus the US Dollar.
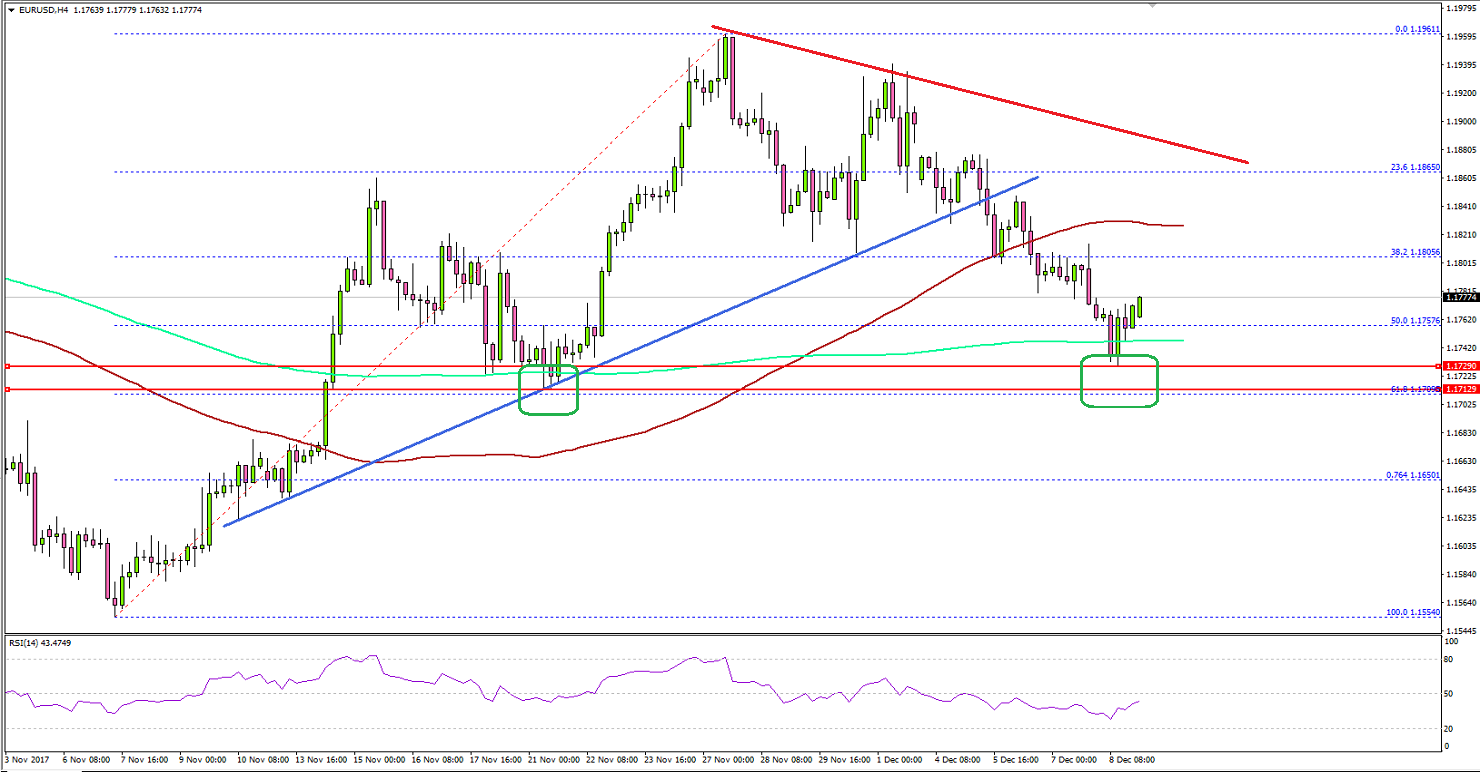
EURUSD broke a key bullish trend line at 1.1840 on the 4-hours chart, but does that mean a change in trend?
Chinese Consumer Price Index in Nov 2017 increased by 1.7% compared with the +1.8% forecast.
Chinese Producer Price Index in Nov 2017 jumped by 5.8%, less than the +5.9% forecast.
EURUSD Technical Analysis
During late November 2017, the Euro failed to move above 1.1950-1.2000 against the US Dollar. The EUR/USD declined since then and broke key supports such as 1.1900 and 1.1840.However, does the recent downside break can be seen as a trend change in EUR/USD? Well, the current price action seems corrective from the 1.1960 swing high. The pair has breached the 38.2% Fib retracement level of the last major upside wave from the 1.1554 low to 1.1961 high.The pair also settled below 1.1800 and the 100 simple moving average (red, 4-hour). Having said that, there is a major support on the downside at 1.1720-1.1740. The stated region is also around the 61.8% Fib retracement level of the last major upside wave from the 1.1554 low to 1.1961 high.The 1.1700 support is a pivot level and a break below it won’t be easy. Therefore, as long as the pair is above the 1.1700 support, the current downside can be considered as a correction.Should there be a close below the 1.1700 handle, the pair might decline further and will most likely establish a medium term downtrend.On the upside, the broken support at 1.1840 and the 100 simple moving average (red, 4-hour) are resistance zones. Once the pair break these resistances, it could resume its uptrend and move past 1.1900.
Chinese CPI
The start to this week was not very positive since China’s CPI in November posted a rise of 1.7% (YoY), which was less than the forecast of +1.8% and even less than the last +1.9%.In terms of the monthly change, the CPI remained flat at 0%. Looking at the Producer Price Index in Nov 2017, there was an increase of 5.8%, which was less than the +5.9% forecast.Today, the economic calendar is light, which means the market moves might be limited and will most likely depend on the current sentiment. Last week’s positive US NFP release (228K versus 200K forecast) accelerated USD/JPY’s rise towards 114.00. Therefore, there can be more upsides in the US Dollar in the short term.

 However, does the recent downside break can be seen as a trend change in EUR/USD? Well, the current price action seems corrective from the 1.1960 swing high. The pair has breached the 38.2% Fib retracement level of the last major upside wave from the 1.1554 low to 1.1961 high.The pair also settled below 1.1800 and the 100 simple moving average (red, 4-hour). Having said that, there is a major support on the downside at 1.1720-1.1740. The stated region is also around the 61.8% Fib retracement level of the last major upside wave from the 1.1554 low to 1.1961 high.The 1.1700 support is a pivot level and a break below it won’t be easy. Therefore, as long as the pair is above the 1.1700 support, the current downside can be considered as a correction.Should there be a close below the 1.1700 handle, the pair might decline further and will most likely establish a medium term downtrend.On the upside, the broken support at 1.1840 and the 100 simple moving average (red, 4-hour) are resistance zones. Once the pair break these resistances, it could resume its uptrend and move past 1.1900.
