
Aayush Jindal
Key Highlights
- Gold price started a fresh increase above $1,288and $1,300 resistances against the US Dollar.
- There was a break above a key bearish trend lineat $1,281 on the 4-hours chart of XAU/USD.
- The US Factory Orders in April 2019 declined0.8%, less than the -0.9% forecast.
- The US ISM Non-Manufacturing Index in May 2019is likely to remain stable at 55.5.
Gold Price Technical Analysis
The $1,275 level acted as a strong support and gold price bounced back against the US Dollar. The price broke the key $1,288 and $1,295 resistance levels to move into a positive zone.
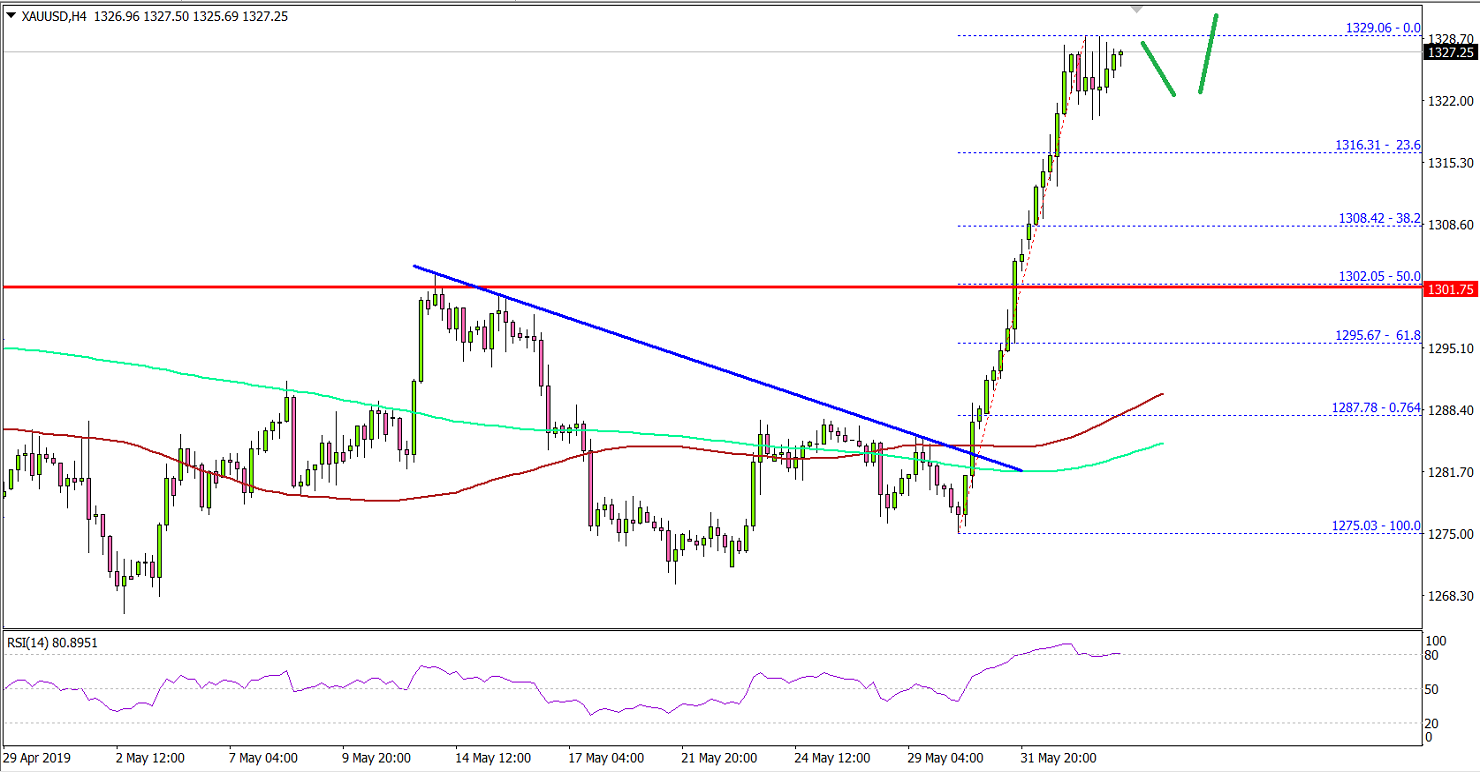
The 4-hours chart of XAU/USD indicates that the price surpassedthe $1,300 resistance area and the 100 simple moving average (4-hours, red).There was a close above the $1,310 level and the 200 simple moving average(4-hours, green).
The bulls gained traction, resulting in a solid upward moveabove the $1,320 level. The price traded close to the $1,300 level and it iscurrently consolidating gains.
On the upside, an immediate resistance is near the $1,330and $1,335 levels. If there is an upside break above $1,335, the price couldaccelerate above the $1,340 level.
On the downside, an initial support is near the $1,316 levelor the 23.6% Fib retracement level of the last wave from the $1,275 swing lowto $1,329 swing high. If there is an extended downside correction, the pricemight find bids near the $1,300 support area.
Looking at the major pairs, EUR/USD gained momentum above the 1.1225 resistance level and GBP/USD is slowly recovering above the 1.2650 level.
Economic Releases to Watch Today
- Germany’s Services PMI for May 2019 - Forecast 55.0,versus 55.0 previous.
- Euro Zone Services PMI for May 2019 – Forecast 52.5,versus 52.5 previous.
- UK Services PMI for May 2019 – Forecast 50.6,versus 50.4 previous.
- US Services PMI for May 2019 – Forecast 50.9,versus 50.9 previous.
- US ISM Non-Manufacturing Index for May 2019 –Forecast 55.5, versus 55.5 previous.
