USDCHF – Dollar Remains in the Driver’s Seat versus CHF
Aayush Jindal
Key Highlights
US Dollar continued to rocket higher against the Swiss franc, as the latter one weakened a lot recently.
US Initial Jobless Claims released by the US Department of Labor increased from the last reading of 267K to 270K.
US continuing jobless claims was below the forecast and registered a reading of 2.255M.
US Initial Jobless ClaimsEarlier during the NY session, the US Initial Jobless Claims, which is a measure of the number of people filing first-time claims for state unemployment insurance was released by the US Department of Labor. The forecast was lined up for a rise from 267K to 273K in the week ending August 1, the advance figure for seasonally adjusted. However, the outcome was better than the market expectation, as the US Initial Jobless Claims came in at 270K. The 4-week moving average is at 268,250, which is 6,500 less compared to the previous week's unrevised average of 274,750.The US continuing jobless claims data was disappointing, as it missed the mark. It came in at 2.255M, which was more than the forecast of 2.240M. The 4-week moving average is at 2,239,000, which is 18,000 less than the previous week's revised average of 2,257,000.When we look at the unadjusted data, the advance number of actual initial claims was 225,090 in the week ending August 1, which was about 5,133 less compared to the previous week.USDCHF Technical AnalysisThe USDCHF pair traded higher today, and even cleared the weekly high to trade above 0.9820. The mentioned area was a major hurdle for buyers, and a break above it signals that more gains are likely in the near term.There is an expanding triangle pattern formed on the hourly chart of the USDCHF pair, which is currently acting as a resistance for the pair. A break above the triangle resistance trend line could clear the way for more upsides moving ahead.On the downside, an initial support can be around the 38.2% Fib retracement level of the last wave from the 0.9766 low to 0.9846 high, followed by the 50% Fib retracement level.

 The US continuing jobless claims data was disappointing, as it missed the mark. It came in at 2.255M, which was more than the forecast of 2.240M. The 4-week moving average is at 2,239,000, which is 18,000 less than the previous week's revised average of 2,257,000.When we look at the unadjusted data, the advance number of actual initial claims was 225,090 in the week ending August 1, which was about 5,133 less compared to the previous week.USDCHF Technical AnalysisThe USDCHF pair traded higher today, and even cleared the weekly high to trade above 0.9820. The mentioned area was a major hurdle for buyers, and a break above it signals that more gains are likely in the near term.
 There is an expanding triangle pattern formed on the hourly chart of the USDCHF pair, which is currently acting as a resistance for the pair. A break above the triangle resistance trend line could clear the way for more upsides moving ahead.On the downside, an initial support can be around the 38.2% Fib retracement level of the last wave from the 0.9766 low to 0.9846 high, followed by the 50% Fib retracement level.
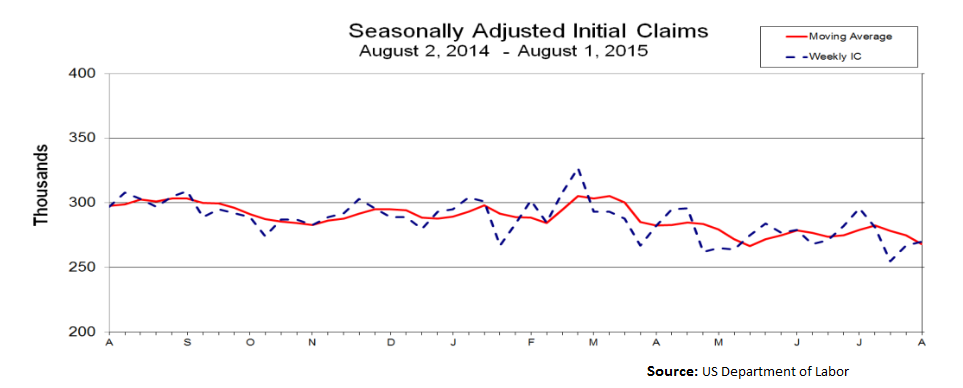 The US continuing jobless claims data was disappointing, as it missed the mark. It came in at 2.255M, which was more than the forecast of 2.240M. The 4-week moving average is at 2,239,000, which is 18,000 less than the previous week's revised average of 2,257,000.When we look at the unadjusted data, the advance number of actual initial claims was 225,090 in the week ending August 1, which was about 5,133 less compared to the previous week.USDCHF Technical AnalysisThe USDCHF pair traded higher today, and even cleared the weekly high to trade above 0.9820. The mentioned area was a major hurdle for buyers, and a break above it signals that more gains are likely in the near term.
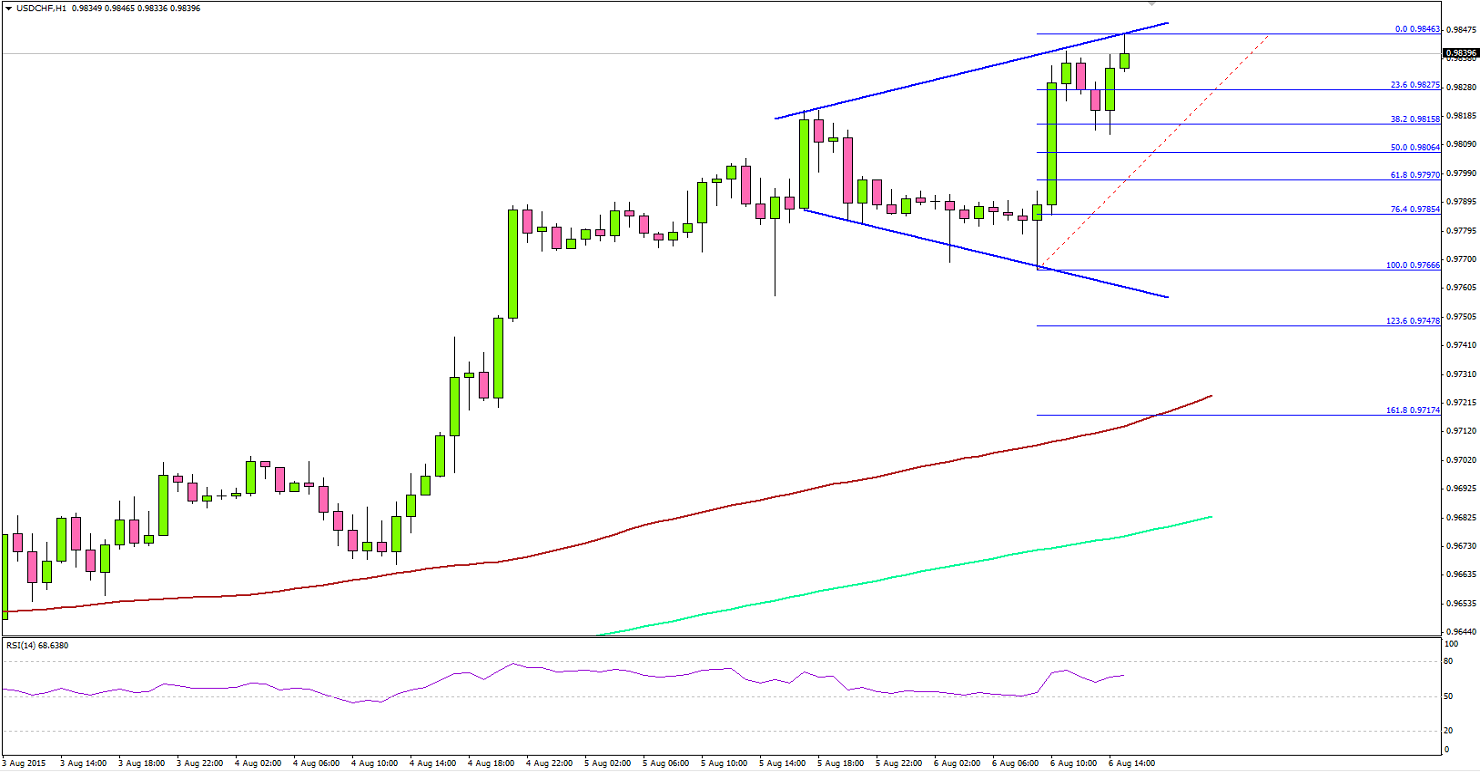 There is an expanding triangle pattern formed on the hourly chart of the USDCHF pair, which is currently acting as a resistance for the pair. A break above the triangle resistance trend line could clear the way for more upsides moving ahead.On the downside, an initial support can be around the 38.2% Fib retracement level of the last wave from the 0.9766 low to 0.9846 high, followed by the 50% Fib retracement level.
