Crude oil price corrected lower and tested the $73.00 support area against the US dollar.
There are two bullish trend lines in place with support at $73.30 and $72.40 on the 4-hours chart of XTI/USD.
The NFIB Business Optimism Index in Sep 2018 declined from 108.8 to 107.9.
The US Producer Price Index for Sep 2018 will be released today, which is forecasted to increase 0.2% (MoM).
Crude Oil Price Technical Analysis
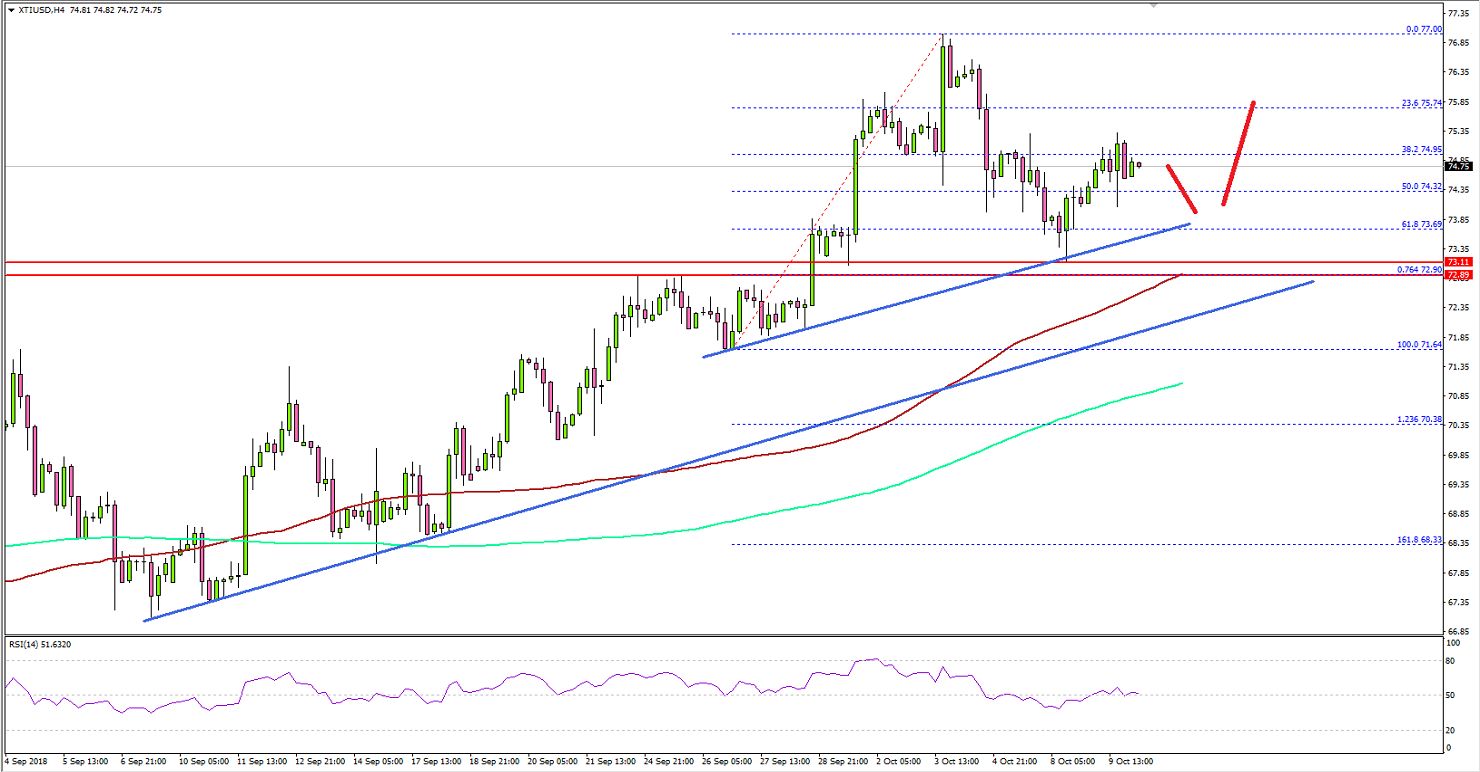
After a major upward move, crude oil price found resistance near $77.00 against the US Dollar. The price started a downside correction and traded below the $75.00 and $74.00 support levels.Looking at the 4-hours chart of XTI/USD, the price traded below the 61.8% Fib retracement level of the last wave from the $71.64 low to $77.00 high. However, the decline was protected by the $72.80-73.00 support area, which was a major resistance earlier.The 76.4% Fib retracement level of the last wave from the $71.64 low to $77.00 high is also positioned near the $72.90 level. More importantly, there are two bullish trend lines in place with support at $73.30 and $72.40 on the same chart.Below the first trend line, the 100 (red) simple moving average (4-hours) is positioned at $72.80. Therefore, there are many key supports near the $73.00, $72.90 and $72.80 levels. As long as the price is above these supports, it could resume its upside move towards $76.00.On the other hand, if there is a downside break and close below $72.40 plus the 100 SMA, there may be an extended slide towards the $70.00 support area.Looking at the major forex majors, EUR/USD declined sharply and traded below the 1.1460 support area. GBP/USD also struggled to clear the 1.3100-1.3110 resistance area.
Economic Releases to Watch Today
UK GDP for August 2018 (MoM) - Forecast +0.1%, versus +0.3% previous.
UK Industrial Production for August 2018 (MoM) - Forecast +0.1%, versus +0.1% previous.
UK Manufacturing Production for August 2018 (MoM) - Forecast +0.1%, versus -0.2% previous.
UK Trade Balance non-EU for August 2018 - Forecast £-3.1B, versus £-2.8B previous.
UK Goods Trade Balance for August 2018 - Forecast £-10.90B, versus £-9.97B previous.
US Wholesale Inventories for August 2018 – Forecast +0.8%, versus +0.8% previous.
US Producer Price Index Sep 2018 (MoM) – Forecast +0.2%, versus -0.1% previous.
US Producer Price Index Sep 2018 (YoY) – Forecast +2.8%, versus +2.8% previous.

 Looking at the 4-hours chart of XTI/USD, the price traded below the 61.8% Fib retracement level of the last wave from the $71.64 low to $77.00 high. However, the decline was protected by the $72.80-73.00 support area, which was a major resistance earlier.The 76.4% Fib retracement level of the last wave from the $71.64 low to $77.00 high is also positioned near the $72.90 level. More importantly, there are two bullish trend lines in place with support at $73.30 and $72.40 on the same chart.Below the first trend line, the 100 (red) simple moving average (4-hours) is positioned at $72.80. Therefore, there are many key supports near the $73.00, $72.90 and $72.80 levels. As long as the price is above these supports, it could resume its upside move towards $76.00.On the other hand, if there is a downside break and close below $72.40 plus the 100 SMA, there may be an extended slide towards the $70.00 support area.Looking at the major forex majors, EUR/USD declined sharply and traded below the 1.1460 support area. GBP/USD also struggled to clear the 1.3100-1.3110 resistance area.
