
Aayush Jindal
Key Highlights
- Crude oil price declined heavily and broke thekey $60.50 support area against the US dollar.
- There was a break below a major ascendingchannel with support at $61.40 on the 4-hours chart of XTI/USD.
- The Richmond Fed Manufacturing Index in May 2019increased from 3 to 5.
- The US GDP in Q1 2019 (Preliminary) could grow3.1%, less than the last 3.2%.
Crude Oil Price Technical Analysis
After multiple rejections near the $64.00 level, crude oil price started a strong downward move against the US Dollar. The price broke the key $61.20 and $60.50 support levels to enter a bearish zone.
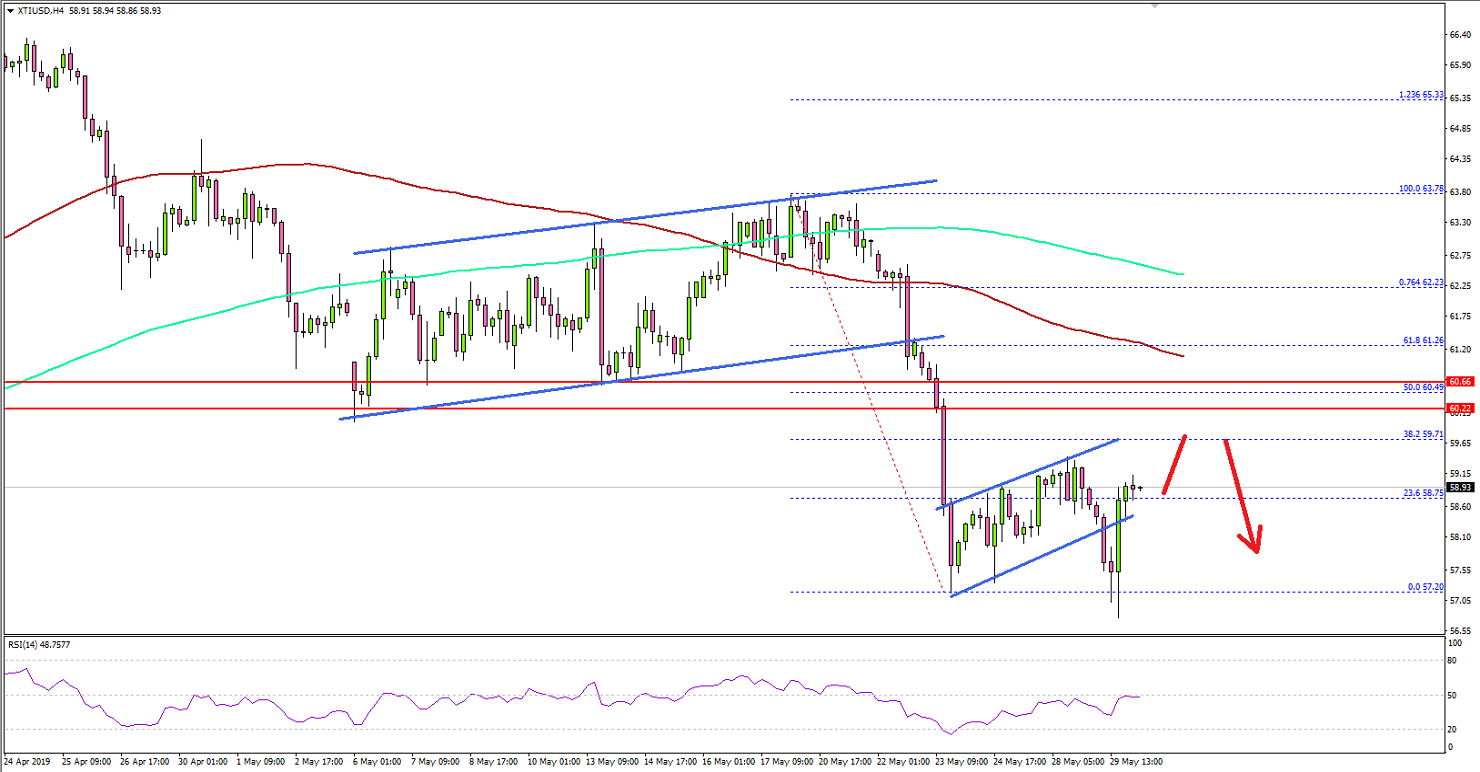
Looking at the 4-hours chart of XTI/USD, theprice settled below the $60.00 pivot level, the 100 (red) simple moving average(4-hours), and the 200 (green) simple moving average (4-hours).
The price traded as low as $57.20 before starting an upsidecorrection. There was a recovery above the $58.80 level and the 23.6% Fibretracement level of the decline from the $63.78 high to $57.20 low.
However, the price failed to gain pace above the $59.50level and recently broke an ascending channel. The current technical structureseems bearish and there are chances of more losses below the $57.00 and $56.00support levels.
The next main support level is near the $55.00 level. On theupside, an initial resistance is at $59.20, above which the price could recovertowards the $60.00 resistance level.
Fundamentally, the Richmond Fed Manufacturing Index for May2019 was released by Federal Reserve Bank of Richmond. The market was lookingfor an increase from 3 to 6.
The actual result was lower than the forecast, as the RichmondFed Manufacturing Index increased to 3 to 5. Shipments and new orders weremostly flat, and employment remained positive.
The report added:
Firms continued to struggle to find workers with the necessary skills as this index dropped from −8 in April to −20 in May.
Looking at major pairs, EUR/USD and GBP/USD declined heavily below key supports and they might continue to slide in the near term.
Economic Releases to Watch Today
- US Initial Jobless Claims - Forecast 215K,versus 211K previous.
- US Gross Domestic Product Q1 2019 (Preliminary)– Forecast 3.1% versus previous 3.2%.