Crude Oil Price Moved Into Bullish Zone above $61.50
Aayush Jindal
Key Highlights
Crude oil price formed a major support at $60.20 and moved higher against the US dollar.
There was a break above a major bearish trend line with resistance near $61.25 on the 4-hours chart of XTI/USD.
The price is now trading nicely above the $62.00 resistance and in a positive zone.
Today in the UK, the CPI report for Feb 2018 will be released, and the market is looking for a 2.8% rise in the CPI (YoY).
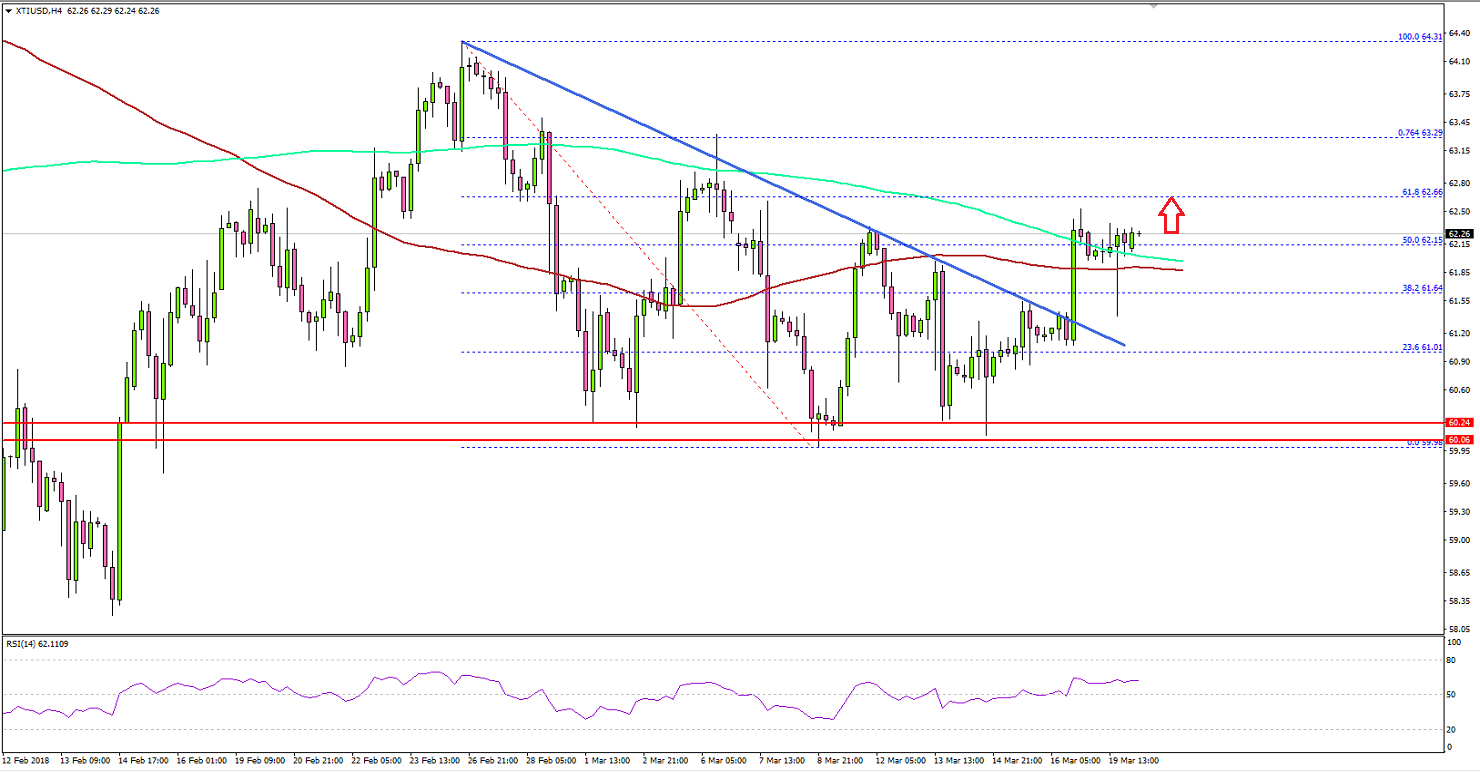
Crude Oil Price Technical Analysis
There was a solid support base formed above $60.00 in crude oil price against the US dollar. As a result, there was a steady upside move and the price broke a major resistance near $61.20.Looking at the 4-hours chart of XTI/USD, sellers made many attempts to push the price below $60.00. However, they failed and the price started an upside move above the $61.00 level.During the upside, there was a break above the 23.6% Fibonacci retracement level of the last decline from the $64.31 high to $59.98 low.More importantly, there a break above a major bearish trend line with resistance near $61.25 on the same chart. The price moved above the $62.00 handle and the 38.2% Fibonacci retracement level of the last decline from the $64.31 high to $59.98 low.These all are positive signs above $62.00. On the upside, the next major resistance sits near the $62.50-60 area. Above $62.60, the price may attempt a move towards the $64.00 level.On the downside, an initial support is around $62.00 level. However, the most important support is near the broken resistance near $61.20-25, which will most likely act as a decent support zone.
Economic Releases to Watch Today
UK Retail Price Index Feb 2018 (YoY) – Forecast +3.7%, versus +4.0% previous.
UK Producer Price Index Feb 2018 (YoY) – Forecast +3.8%, versus +4.7% previous.
UK Producer Price Index Feb 2018 (MoM) – Forecast +0.1%, versus +0.1% previous.
UK Consumer Price Index Feb 2018 (YoY) – Forecast +2.8%, versus +3.0% previous.
UK Core Consumer Price Index Feb 2018 (YoY) – Forecast +2.5%, versus +2.7% previous.
German ZEW Business Economic Sentiment Index for March 2018 – Forecast 13.0, versus 17.8 previous.

 During the upside, there was a break above the 23.6% Fibonacci retracement level of the last decline from the $64.31 high to $59.98 low.More importantly, there a break above a major bearish trend line with resistance near $61.25 on the same chart. The price moved above the $62.00 handle and the 38.2% Fibonacci retracement level of the last decline from the $64.31 high to $59.98 low.These all are positive signs above $62.00. On the upside, the next major resistance sits near the $62.50-60 area. Above $62.60, the price may attempt a move towards the $64.00 level.On the downside, an initial support is around $62.00 level. However, the most important support is near the broken resistance near $61.20-25, which will most likely act as a decent support zone.