
Aayush Jindal
Key Highlights
- Gold price gained significantly above $1,400 and$1,420 against the US Dollar.
- A key bullish trend line is forming with supportnear $1,412 on the 4-hours chart of XAU/USD.
- The US New Home Sales in May 2019 declined 7.8%(MoM), whereas the forecast was +1.9%.
- The US Durable Goods Orders in May 2019 mightincrease 0.2%.
Gold Price Technical Analysis
After a successful close above the $1,400 resistance, gold price accelerated gains against the US Dollar. The price even broke the $1,420 resistance and traded close to $1,440 before correcting lower.
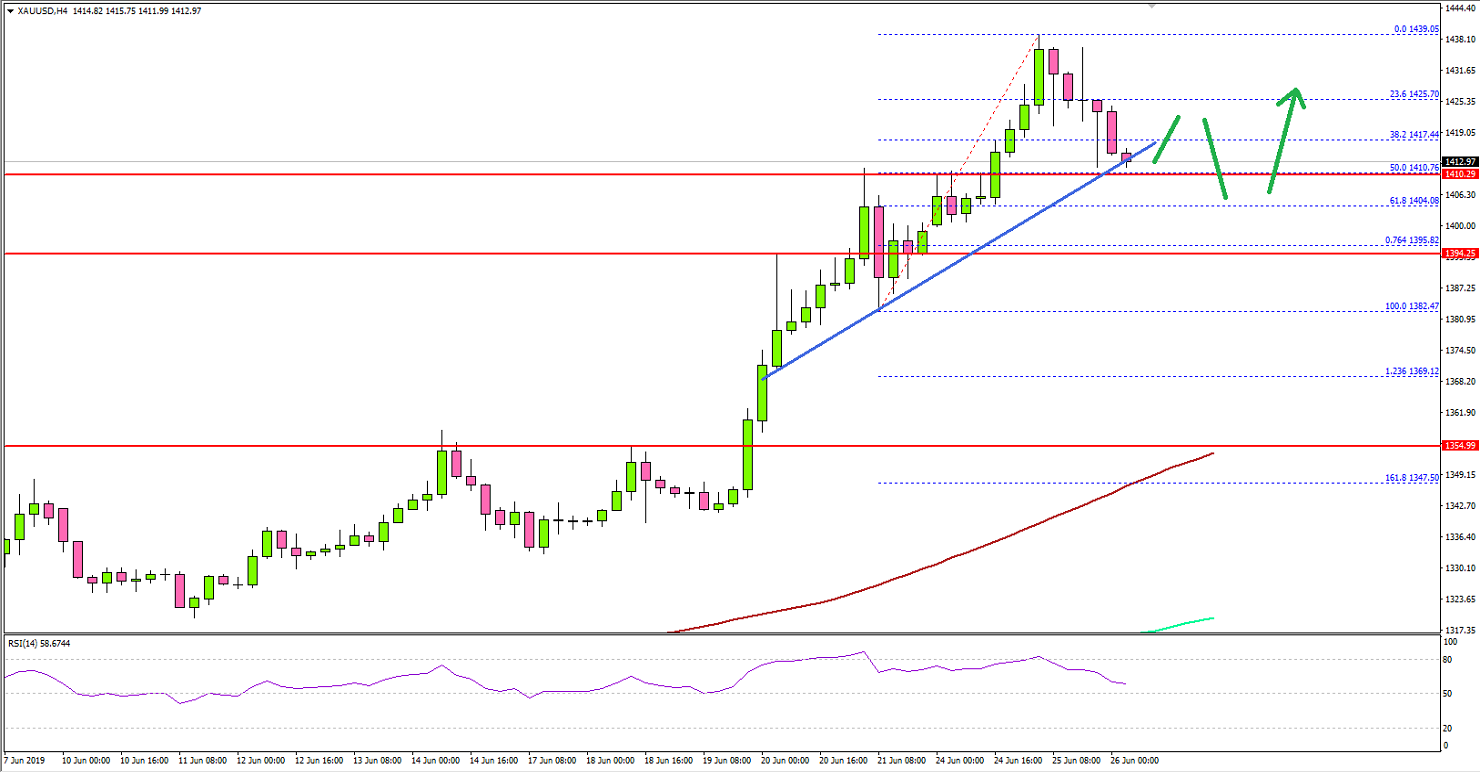
The 4-hours chart of XAU/USD indicates that the price settlednicely above the $1,425 level. It is now trading well above the 100 simplemoving average (4-hours, red) and the 200 simple moving average (4-hours,green).
The last swing high was formed at $1,439 before the pricecorrected below the $1,430 level. There was a break below the 23.6% Fibretracement level of the last wave from the $1,382 low to $1,439 high.
However, the correction found support near the $1,412 leveland the price stayed above the 50% Fib retracement level of the last wave fromthe $1,382 low to $1,439 high.
More importantly, there is a key bullish trend line formingwith support near $1,412 on the 4-hours chart of XAU/USD. As long as the priceis trading above the trend line, it could climb again above the $1,420 and $1,425levels in the coming sessions. Conversely, it could slide towards the $1,400support before a fresh increase.
Fundamentally, the US New Home Sales report for May 2019 wasreleased by the US Census Bureau. The market was looking for a 1.9% rise insales in May 2019, compared with the previous month.
However, the actual result was very disappointing sincethere was a 7.8% drop in sales. On the other hand, the last reading was revisedup from -6.9% to -3.7%.
The report stated:
Sales of new single‐family houses in May 2019 were at a seasonally adjusted annual rate of 626,000. This is 7.8 percent (±14.7 percent) below the revised April rate of 679,000 and is 3.7 percent (±15.0 percent) below the May 2018 estimate of 650,000.
Overall, the US Dollar seems to be struggling to recover, resulting in positive moves inEUR/USD, GBP/USD and gold price.
Economic Releases to Watch Today
- US Durable Goods Orders May 2019 – Forecast+0.2% versus -2.1% previous.
- US Nondefense Capital Goods Orders Ex AircraftMay 2019 - Forecast +0.1% versus -1.0% previous.
- US Wholesale Inventories April 2019(preliminary) – Forecast +0.5%, versus +0.8% previous.
