Gold price is in a major uptrend and it recently broke the $1300-1320 resistance zone against the US Dollar.
There are two key bullish trend lines forming with support at $1325 and $1320 on the 4-hours chart of XAU/USD.
The price remains in an uptrend as long as it is above the $1320 level.
The US Industrial Production in Dec 2017 increased by 0.9%, more than the forecast of +0.4%.
Gold Price Technical Analysis
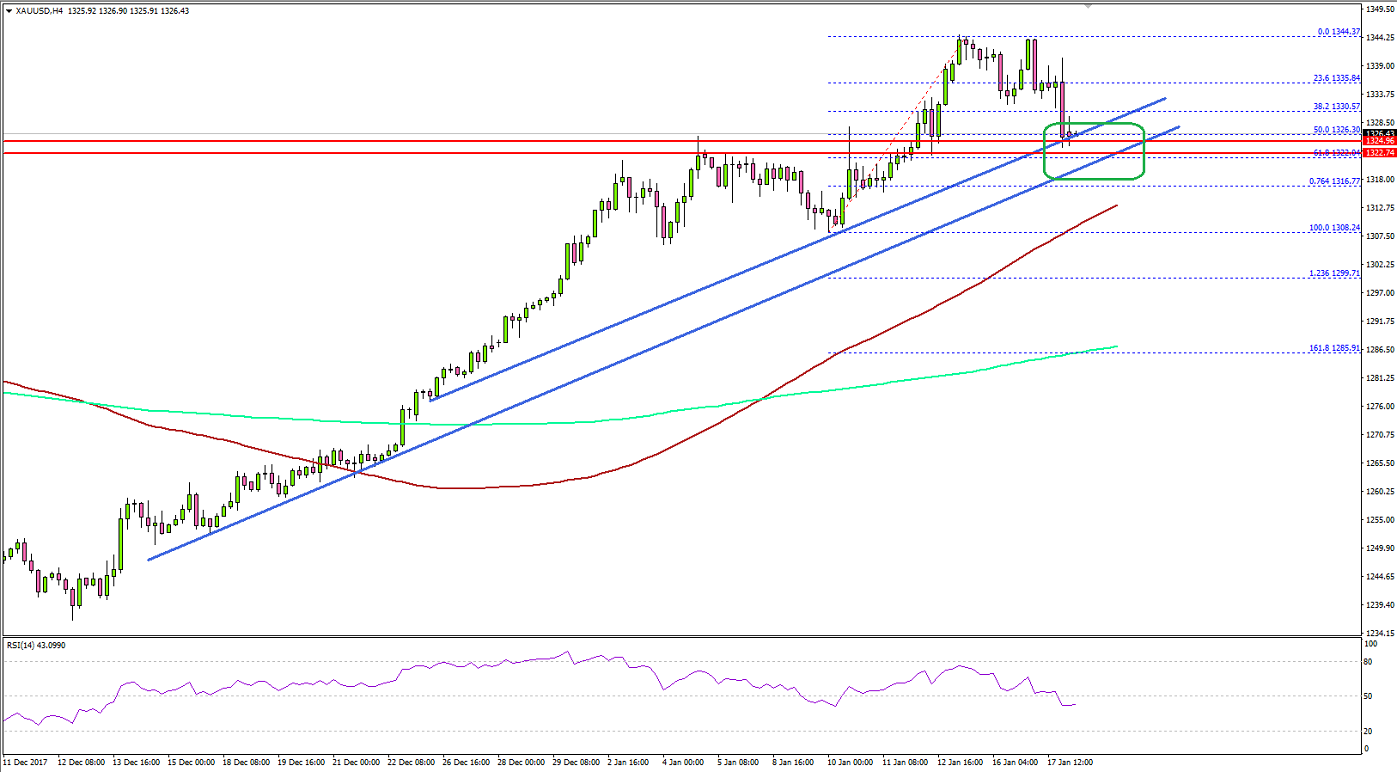
There were heavy upsides noted in Gold price from the $1250 support against the US Dollar. The price climbed above the $1280, $1300 and $1320 resistances to place itself in the bullish zone.Looking at the 4-hours chart of XAU/USD, there is a clear uptrend in place above $1300. The price recently traded as high as $1344.37 and is currently correcting lower.There are two key bullish trend lines forming with support at $1325 and $1320 on the same chart. An intermediate support was broken at the 38.2% Fib retracement level of the last leg from the $1308 low to $1344 high.A key support and buy zone is around $1320-25 since it is near the 50% Fib retracement level of the last leg from the $1308 low to $1344 high. Clearly, there are many supports on the way down starting with $1325 up to $1320.Should there be a close below $1320, the price may move into a short-term bearish trend for a test of the $1300 and $1280 support levels.On the flip side, an initial resistance is at $1345. A successful close above $1345 could open the doors for further gains toward the $1380 level.Recently, the US saw the release of the Industrial Production for Dec 2017. The market was looking for an increase of 0.4% in Dec 2017 compared with the previous month. The actual result exceeded the forecast as there was an increase of 0.9%.Initially, there was no major help for the greenback after the release since major pairs such as EUR/USD and GBP/USD were seen trading higher. Later, both pairs moved down and trimmed gains. Moreover, USD/JPY started an upside recovery and traded above 111.00.

 Looking at the 4-hours chart of XAU/USD, there is a clear uptrend in place above $1300. The price recently traded as high as $1344.37 and is currently correcting lower.There are two key bullish trend lines forming with support at $1325 and $1320 on the same chart. An intermediate support was broken at the 38.2% Fib retracement level of the last leg from the $1308 low to $1344 high.A key support and buy zone is around $1320-25 since it is near the 50% Fib retracement level of the last leg from the $1308 low to $1344 high. Clearly, there are many supports on the way down starting with $1325 up to $1320.Should there be a close below $1320, the price may move into a short-term bearish trend for a test of the $1300 and $1280 support levels.On the flip side, an initial resistance is at $1345. A successful close above $1345 could open the doors for further gains toward the $1380 level.Recently, the US saw the release of the Industrial Production for Dec 2017. The market was looking for an increase of 0.4% in Dec 2017 compared with the previous month. The actual result exceeded the forecast as there was an increase of 0.9%.Initially, there was no major help for the greenback after the release since major pairs such as EUR/USD and GBP/USD were seen trading higher. Later, both pairs moved down and trimmed gains. Moreover, USD/JPY started an upside recovery and traded above 111.00.
