
Aayush Jindal
Key Highlights
- The US Dollar declined heavily below the 1.3400support area against the Canadian Dollar.
- USD/CAD is likely to face resistance near the1.3330 and 1.3350 levels.
- The US PPI in May 2019 increased 1.8% (YoY),less than the +2.0% forecast.
- The US CPI in May 2019 could increase 0.1%(MoM), less than the last +0.3%.
USDCAD Technical Analysis
In the past few days, the US Dollar struggled against the Canadian Dollar and declined sharply from well above 1.3500. The USD/CAD pair broke the key 1.3440 and 1.3400 support levels to move into a bearish zone.
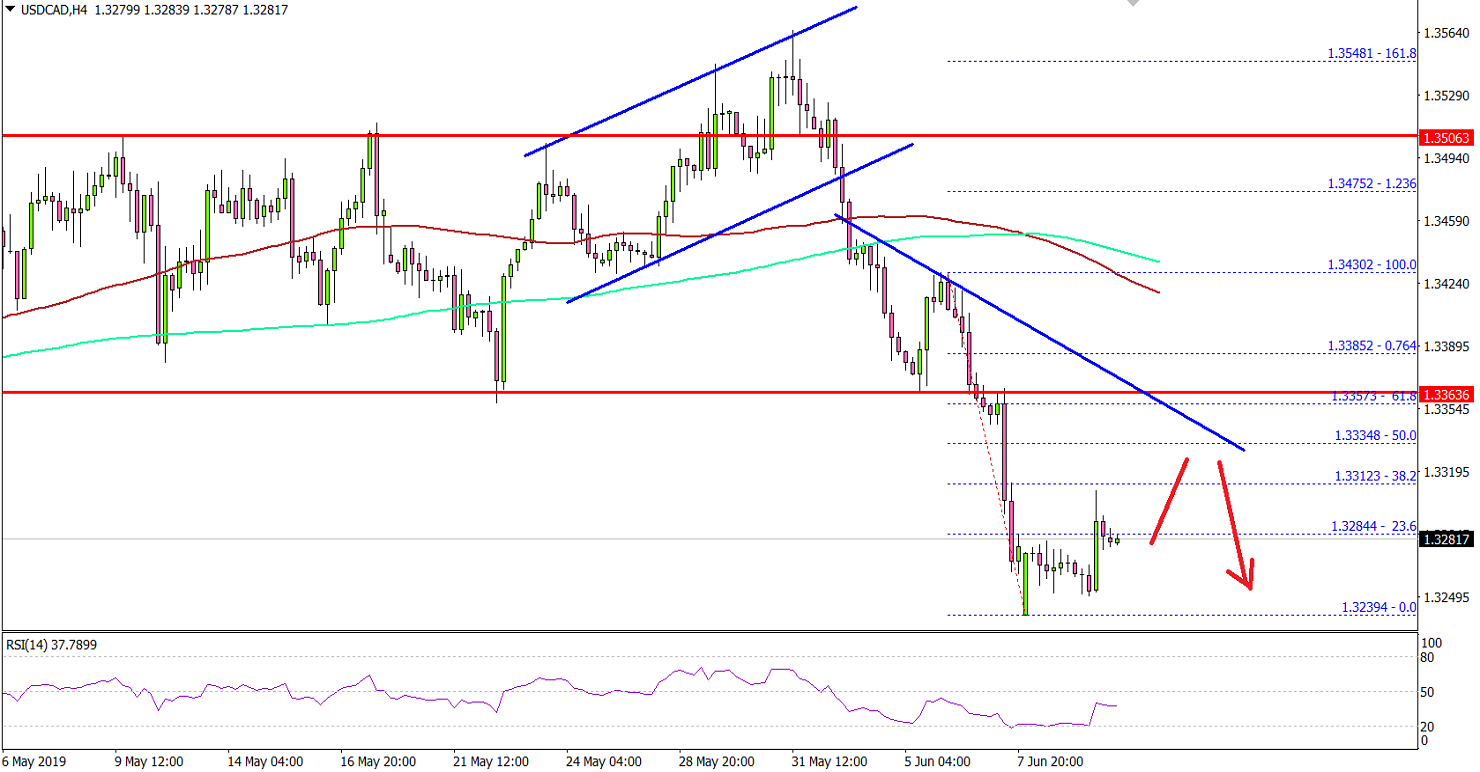
Looking at the 4-hours chart, the pair gained bearishmomentum below the 1.3350 level and the 100 simple moving average (red,4-hours). The pair even broke the 1.3300 support and settled well below the 200simple moving average (green, 4-hours).
A new monthly low was formed near 1.3239 and recently thepair corrected higher. It cleared the 1.3280 level plus the 23.6% Fibretracement level of the last downward move from the 1.3430 high to 1.3239 low.
On the upside, there are many resistances near the 1.3320,1.3330 and 1.3350 levels. There is also a major bearish trend line in placewith resistance near 1.3350 on the same chart.
Moreover, the 50% Fib retracement level of the last downwardmove from the 1.3430 high to 1.3239 low is likely to prevent gains near 1.3334.
Fundamentally, the US PPI report for May 2019 was released bythe Bureau of Labor statistics, Department of Labor. The market was looking fora 2.0% rise in the PPI compared with the same month a year ago.
However, the actual result was disappointing as the PPIincreased 1.8% (YoY). Looking at the Producer Price Index ex Food & energy,there was a 2.3% rise, similar to the forecast.
The report stated that:
Final demand services: Prices for final demand services moved up 0.3 percent in May, the fourth consecutive increase. Most of the May advance can be traced to the index for final demand services less trade, transportation, and warehousing, which rose 0.5 percent.
Overall, USD/CAD remains in a downtrend as long as it isbelow the 1.3350 resistance. On the downside, an initial support is at 1.3250,below which there is a risk of a drop to 1.3200.
Economic Releases to Watch Today
- US Consumer Price Index May 2019 (MoM) –Forecast +0.1%, versus +0.3% previous.
- US Consumer Price Index May 2019 (YoY) –Forecast +1.9%, versus +2.0% previous.
- US Consumer Price Index Ex Food & Energy May2019 (YoY) – Forecast +2.1%, versus +2.1% previous.
