
Aayush Jindal
Key Highlights
- The US Dollar started a decent recovery from 106.80against the Japanese Yen.
- USD/JPY is facing a strong resistance near108.20 and a bearish trend line on the 4-hours chart.
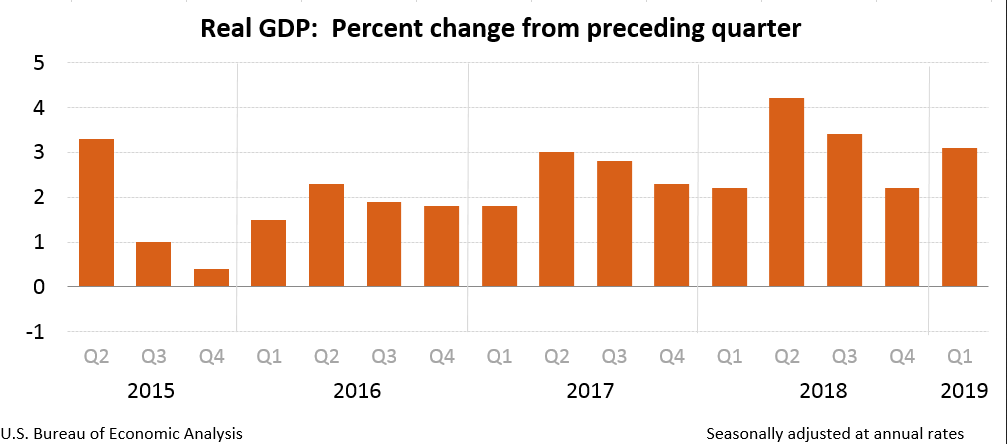
- The US GDP in Q1 2019 grew 3.1%, similar to the marketexpectation.
- The US Personal Income in May 2019 could rise0.4% (MoM), more than the last +0.3%.
USDJPY Technical Analysis
After a significant decline, the US Dollar found support near 106.80 against the Japanese Yen. The USD/JPY pair started a short term recovery and recently climbed above the 107.50 resistance.
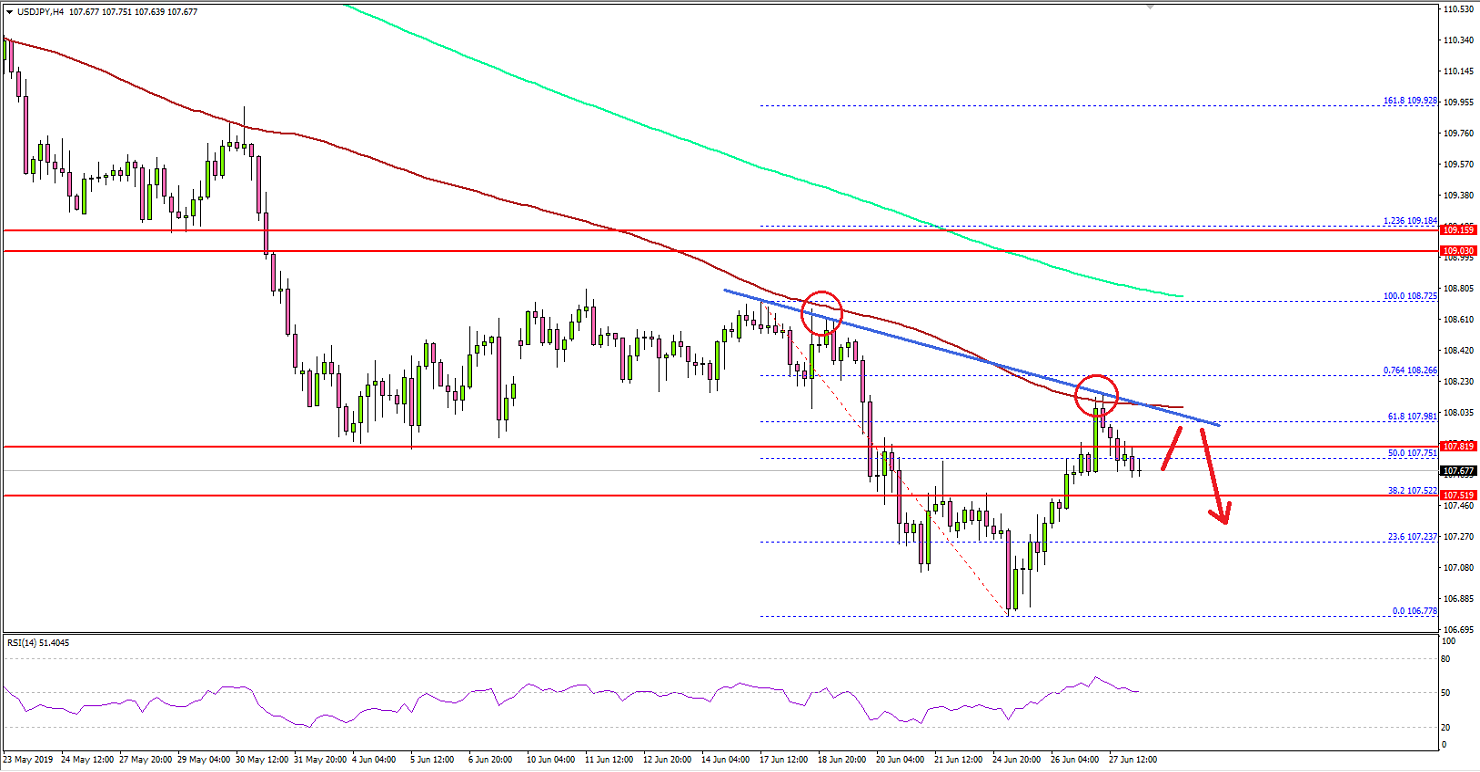
Looking at the 4-hours chart, the pair managed to climbabove the 107.65 pivot level and the 50% Fib retracement level of the downwardmove from the 108.72 high to 106.77 low.
The pair even spiked towards the 108.00 level, but the 100simple moving average (red, 4-hours) acted as a strong resistance. It seemslike the pair is facing a major hurdle near 108.20 and a bearish trend line onthe same chart.
The 76.4% Fib retracement level of the downward move fromthe 108.72 high to 106.77 low is also near the 108.22 level. Therefore, asuccessful follow through above the trend line and the 100 SMA is needed forfurther gains.
Conversely, if USD/JPY fails to move above the 108.20resistance, there could be a fresh decline. An initial support is near the107.50 level, below which the pair may revisit the 107.00 level.
Fundamentally, the US Gross Domestic Product Annualized readingwas released by the US Bureau of Economic Analysis. The market was looking fora 3.1% growth in Q1 2019.
The actual result was similar to the forecast, as the US GDP grew 3.1% in Q1 2019, according to the "third" estimate. Looking at the real gross domestic income (GDI), there was a 0.1% rise in Q1 2019, compared with an increase of 0.5% in the fourth quarter.
The report added:
The average of real GDP and real GDI, a supplemental measure of U.S. economic activity that equally weights GDP and GDI, increased 2.1 percent in the first quarter, compared with an increase of 1.3 percent in the fourth quarter.
Overall, USD/JPY is trading near a crucial resistance area,whereas EUR/USD and GBP/USD are trading nicely above key supports.
Economic Releases to Watch Today
- UK GDP for Q1 2019 (QoQ) - Forecast +0.5%, versus+0.5% previous.
- Euro Zone CPI for June 2019 (YoY) (Prelim) -Forecast +1.2%, versus +1.2% previous.
- Euro Zone Core CPI for June 2019 (YoY) (Prelim)- Forecast +1.0%, versus +0.8% previous.
- US Personal Income for May 2019 (MoM) - Forecast+0.4%, versus +0.3% previous.
- Chicago Purchasing Manager’s Index for June 2019– Forecast 53.1, versus 54.0 previous.
